NIFTY Spot : 5995.45
Hi,
Readers,
After sharp fall as was
timely cautioned in my blog dated Nov. 19, 2013 Nifty chart is showing
interesting chart patterns at present.
On one hand on daily charts Nifty is showing that it is on the verge of breaking down
bearish head and shoulder(H&S)
pattern below 5940. And co-incidentally downward sloping channel is also at
5930.
Thus 5930 becomes very
important level. Close below this level will give bearish H&S breakdown
and channel breakdown.
On other hand on hourly
charts Nifty chart is
showing that it is oversold at this point of time. Nifty hourly chart is also
showing +ve divergence on RSI.
Which indicates that
Nifty wants to rebound.
CHARTS ATTACHED.
This week is expiry
week also thus volatility will be there.
For current week 6140 will
be a very important level in case of rebound.
 |
| DAILY CHART SHOWING H&S PATTERN & CHANNEL |
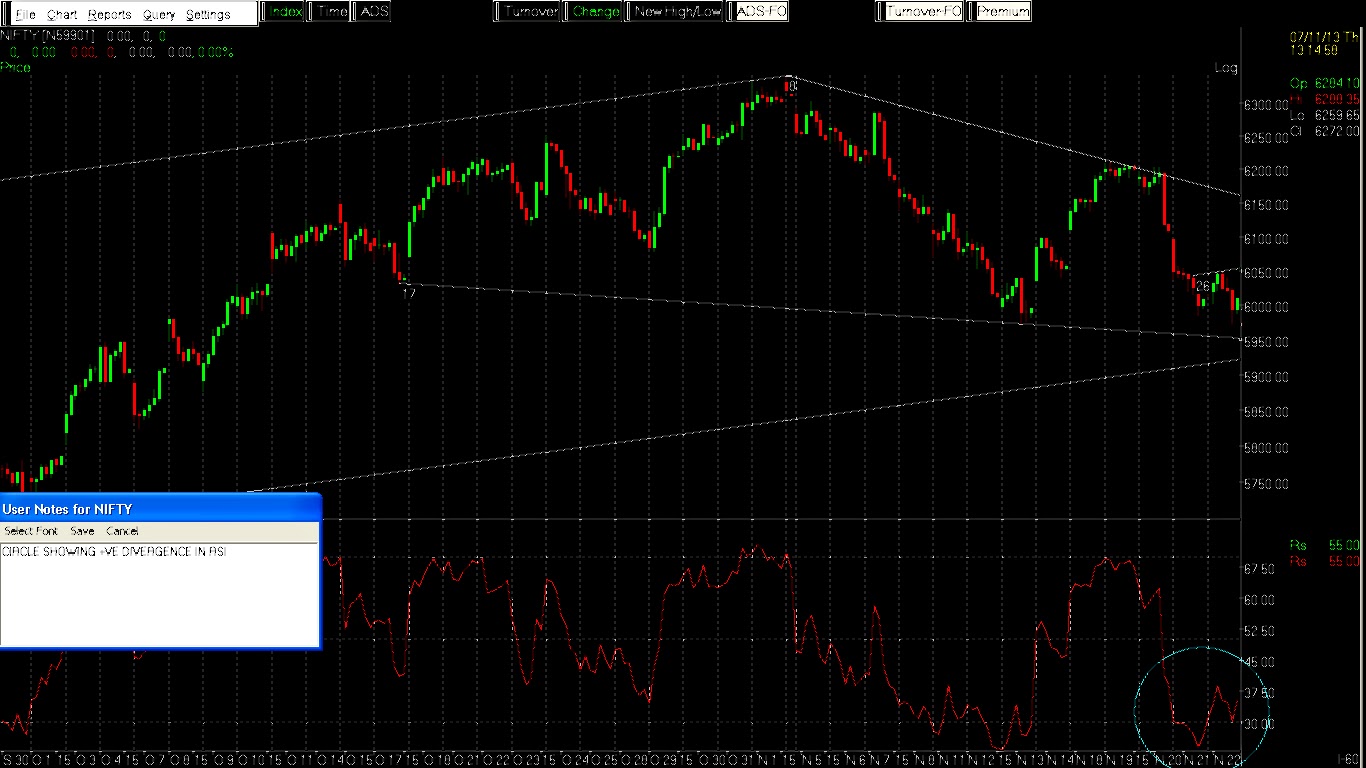 |
| HOURLY CHART SHOWIMG +VE DIVERGENCE ON RSI |
Trade accordingly.
No comments:
Post a Comment